How to follow the trends in equity markets
Updated: 2012-03-12 08:04
By Daryl Guppy (China Daily)
|
||||||||

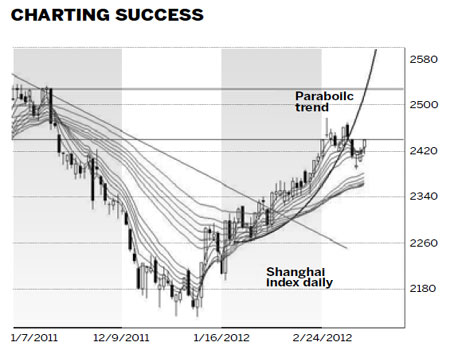
The Shanghai index turned dramatically down on March 6. This was the first significant retreat since the Shanghai index upward trend breakout started on January 6. The breakout was confirmed on Feb 8 when the index moved above the long-term downward trend line. The nature and behavior of this retreat sets the environment for the long-term sustainability of the upward trend.
A breakout from the downward trend does not automatically determine the nature of the new upward trend. Upward trend behavior has four potential behaviors - rally, extended rally, long-term trend or parabolic trend.
The key distinguishing feature of a rally is the way price continues to move upward without any significant retreat. Most times a rally continues for a short time - perhaps 10 to 15 trading days.
An extended rally is less steep and looks like a new sustained upward trend. An extended rally may include some days where there is a strong price retreat but then this is quickly followed by another up day.
A long-term trend is created by a series of rallies, retreats and rebounds. The retreat and rebound points, or valleys, create the key anchor points for the long-term upward trend line. Two anchor points are needed to plot the position of the long-term trend line. Three anchor points confirm the position of the trend line. Investors watched for the Shanghai index retreat to develop a rebound point and a third anchor point for the placement of a long-term upward trend line. They were disappointed.
The parabolic trend is a special type of rally. This trend is created when the rally accelerates and moves up very quickly. The trend is best described with a curved trend line. This trend may last several weeks, and occasionally for several months. Parabolic trends usually collapse very quickly and often have a 50 percent or more retracement. Traders use very tight "protect-profit" stops to manage parabolic trend trades. Also they do not enter the trade again until there is proof that the trend collapse has ended.
The move below 2440 was critical confirmation of the type of breakout trend that had developed in the Shanghai index. It confirmed the breakout trend was parabolic in nature.
The Shanghai index developed a parabolic trend starting in January 19. On March 6 the index moved below the value of the parabolic trend line. The rapid fall in the index is consistent with the behavior when a parabolic trend ends.
On March 6 the index moved below the value of the parabolic trend line. This was a fast fall and there is a high probability the fall will continue. There are several support levels. The first support level is created by the value of the long term Guppy Multiple Moving Averages (GMMA). This indicator uses two groups of moving averages to track the behavior of investors and traders.
The long-term group of averages follows the behavior of investors. This group has compressed, turned upward and then it began to separate. This shows increasing investor support for the new upward trend in the Shanghai market.
The fall below the parabolic trend line will test the strength of investor support for the new upward trend. The support area is between 2360 and 2375. This is the value of the 60-day and the 30-day exponential moving averages and the upper and lower edges of the long term GMMA. Wide separation in this group shows very strong investor support. The current separation is not wide, so support for the new trend is a little weak. A successful test of this support level followed by a rebound will give a very bullish signal.
The big risk in the current situation is that the long term GMMA will not provide good support and a rebound point. A fall below the lower edge of this support level near 2360 has the next long term historical support level near 2300. This is the second support level. This level was a powerful consolidation level in January and February. There is a high probability this level could also provide a strong support level if the market falls below the lower edge of the long term GMMA.
A retreat and rebound behavior will provide a new low point for the calculation of a new upward trend line. This can be used to define a more stable and sustainable long-term upward trend.
Aggressive investors hope for an index rebound from the support area provided by the long term GMMA. A rebound from this level has new upside resistance near 2470 because this is where the extended rally breakout failed. This is a short-term psychological resistance barrier.
The long-term target for a successful rebound is historical resistance near 2530. Moving toward these targets may include slower and more moderate upward trends. These reflect the shift toward more stable and sustainable upward trends based on higher quality but slightly lower 7.5 per cent projected economic growth.
The author is a well-known international financial technical analysis expert.

 Relief reaches isolated village
 Rainfall poses new threats to quake-hit region
 Funerals begin for Boston bombing victims
 Quake takeaway from China's Air Force
 Obama celebrates young inventors at science fair
 Earth Day marked around the world
 Volunteer team helping students find sense of normalcy
 Ethnic groups quick to join rescue efforts
Most Viewed
Editor's Picks

|

|

|

|

|

|
Today's Top News
Health new priority for quake zone
Xi meets US top military officer
Japan's boats driven out of Diaoyu
China mulls online shopping legislation
Bird flu death toll rises to 22
Putin appoints new ambassador to China
Japanese ships blocked from Diaoyu Islands
Inspired by Guan, more Chinese pick up golf
US Weekly

|

|