The point when investors take action
Updated: 2012-05-21 13:31
By Daryl Guppy (China Daily)
|
||||||||
Greece is a drag on every market. If this creates a major reversal in markets then we are headed for a repeat of 2008. If this is a minor top with an upward trend retracement then there is no need to panic. Greece provides the catalyst and investors turn to US markets for guidance.
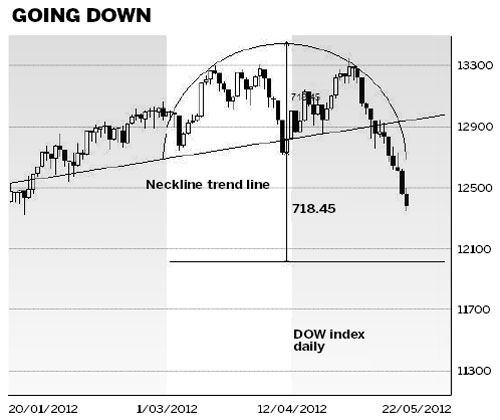
The Dow has developed a minor top upward trend reversal pattern. This pattern has developed within the context of a long-term upward trend line that has been acting as a resistance level. This trend line was a projection of the neckline from the head-and-shoulders pattern that developed between January 2011 and August 2011. In recent months the Dow has used this upward trend line as a resistance level.

A major top of upward trend or end of upward trend pattern is when the pattern measurement target is a large distance below the current index levels. In 2007 the head-and-shoulders pattern downside target was near 11,000, down from a high of 14,000. This indicated a significant market fall so this was a major top of upward trend reversal pattern.
The current Dow pattern of behavior developed a small rounding top pattern over the past 10 weeks. It is the size and depth of this pattern that defines it as a minor pattern. The pattern development time is short, and the height of the pattern is small. These are the features that suggest a minor market retreat rather than a full-scale market collapse that repeats the falls in 2008.
The base of the rounding top is near 12750. The peak of the pattern is near 13400. The depth of the pattern is measured and used to set the downside target. The downside projection has a target near 12000. This level has acted as a support level in the past so there is a high probability it will act as a support level again.
A rebound from 12000 is a bullish outcome because it suggests the underlying upward trend can continue with a renewed and successful push above 13000. Failure of support in the 12000 area has an initial support level near 11500. A rebound developing from this lower support level confirms the long-term upward trend but suggests the upward trend is not strong. In this situation the 13000 level would provide a much stronger resistance barrier.
A fall below 11500 has the next support level near 10500. A fall below 11500 is confirmation that this is a major change in the direction of the trend. Currently there is no evidence in the chart pattern behavior that suggests this is a high probability outcome.
Similar patterns of behavior are seen on the broader S&P 500 index. The rounding top is not as well formed. The left side of the pattern is more steep than on the Dow pattern. The same calculation methods are used and give a downside target near 12100 for the S&P index. This is near to a previous historical support resistance level.
The Nasdaq has a steep upward and downward trend pattern and does not fit comfortably into the rounding top behavior pattern. The Nasdaq also shows a different breakout pattern to the pattern in the S&P and the Dow index. The Nasdaq developed a breakout from a symmetrical triangle pattern. The upside target was near 3140 and this target was achieved. The pullback from this target has a support target near 2700. The market has strong historical support near 2600 so the Nasdaq retreat has a higher probability of pausing at the 2600 level.
These historical support levels are used to provide reference points where there is a higher probability the market will pause, consolidate and potentially develop a change in trend behavior. These levels provide points where investors are ready to take action.
The author is a well-known international financial technical analysis expert.

 Relief reaches isolated village
 Rainfall poses new threats to quake-hit region
 Funerals begin for Boston bombing victims
 Quake takeaway from China's Air Force
 Obama celebrates young inventors at science fair
 Earth Day marked around the world
 Volunteer team helping students find sense of normalcy
 Ethnic groups quick to join rescue efforts
Most Viewed
Editor's Picks

|

|

|

|

|

|
Today's Top News
Health new priority for quake zone
Xi meets US top military officer
Japan's boats driven out of Diaoyu
China mulls online shopping legislation
Bird flu death toll rises to 22
Putin appoints new ambassador to China
Japanese ships blocked from Diaoyu Islands
Inspired by Guan, more Chinese pick up golf
US Weekly

|

|