Oil endures bull-driven pressures
Updated: 2011-09-19 07:58
By Daryl Guppy (China Daily)
|
|||||||||

Oil oils the wheel of economic growth and because of this its price is extremely sensitive to threats of supply disruptions. When hurricanes hammered down on the United States' coastline causing the shutdown of oil rigs many traders expected a jump in the price of oil. It did not develop strongly but the increase in bullish pressure has remained steady with a sustained slow rise in price. Oil at $100 a barrel is now a stronger probability.
Oil has two pricing pressures. The first is the normal balance of supply and demand. In recent months the market has been concerned about the supply side of the equation with problems in the Middle East. Now the attention is shifting to the demand side of the equation. The demand side has two factors and they are pulling in opposite directions.
The first demand factor is the slowdown in the US economy and the potential for a slowdown in the eurozone economy. This reduces demand and puts downwards pressure on oil prices. The stubbornly high 9 percent US unemployment rate is weighing on oil prices. This, and weak US manufacturing figures, suggest the US is not emerging from its economic slowdown.
Add to this the dismal outlook in the eurozone with the collapse of the DAX and the FTSE and its clear message that the brakes will be applied to global economic growth. An economic slowdown reduces oil demand and contributes to pressure for lower prices.
Lower oil prices also have an adverse effect on other energy industries because they lose the price advantage against cheap oil. Higher oil prices boost the competitiveness of solar, vegetable oil-based fuels and other energy solutions. Lower oil prices increase the profit potential of heavy-oil using industries such as aviation and should, in theory, lead to lower airfares.
The second demand factor is the potential for some type of new quantitative easing policy in the United States. This will create more cheap money. This "hot" money does not stay in the United States. Investors put it into new investments that deliver better returns. One of these investment areas is commodities such as oil which is accessed using exchange-traded commodity funds. This creates upward pressure on prices that is not related to changes in demand. This speculative pressure creates a bubble.
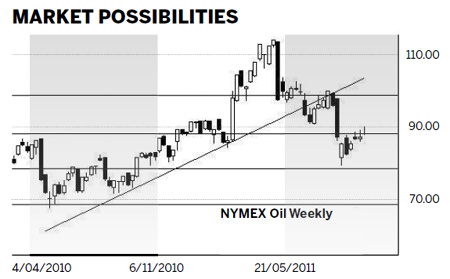
The chart of NYMEX oil prices reflects these conflicting global slowdown pressures but it also shows a developing bullish breakout. This signals the potential to increase global inflationary pressures. The NYMEX oil chart shows two significant features that help establish the limits of the consolidation breakout.
The first is the long-term upward trend line started in August 2010. It was broken in June 2011 with a fall below $96. This was a clear break in the trend. This also signaled an important change in the nature of the trend line. From August 2010 to June 2011 this line acted as a support level. Now this line acts as a resistance level, repelling any price rally.
This resistance line will provide a limit to future price rises and rally breakouts. It makes it more difficult for prices to lift above $105, the current value of the trend line.
The second feature is the pattern of support and resistance levels. These help to define the downside and upside targets for price movements. Oil found support at the historical support level near $78. The next higher resistance level is near $88. This level has been broken with a small breakout. This breakout needs to retreat and retest $88 as a support level before a breakout is fully confirmed. A breakout above this level has the first upside technical target near $98. The psychological resistance level is $100.
The price movement between consolidation bands is often very rapid. This reflects strong reactions to significant changes in political or economic events. When oil is trading below $100 the pattern of support and resistance bands are around $10 wide. A breakout above $88 can move quickly to $98. A move below $78 can drop quickly to $68.
When oil moves above $100 the behavior of the market changes. The first change is an increase in volatility. The price moves up and down more rapidly and more frequently between support and resistance levels than when oil is below $100. The second change in behavior is an increase in the width of the support and resistance bands to around $12.
Currently oil is developing a breakout from the trading band between $78 and $88. Conformation of quantitative easing measures that will boost the US economy will see a very rapid confirmation of breakout from the consolidation pattern with an immediate upside target near $98 to $100. The threats of hurricanes and the normal increase in demand with the onset of winter also add to the bullish pressure.
The author is a well-known international financial technical analysis expert.
(China Daily 09/19/2011 page14)