No panic: Markets shaken but not stirred
Updated: 2011-11-14 07:54
By Daryl Guppy (China Daily)
|
|||||||||
Achange in Italian prime ministers and a new act in the Greek drama was enough to stir global markets. The Dow added a 3 percent fall to its repertoire of volatility. There was talk of panic but this was premature. There is fear in the market, but this is different from panic. There are many chart patterns that confirm the market is fearful, but as yet, there are no chart patterns that suggest panic is developing.

Fear is shown with graphs that include rounding tops, head-and-shoulders patterns and downward sloping triangles. Panic is shown with gap-down patterns, parabolic trends and gaps below strong historical support levels. It also shows up as increases in volume in the right-hand edge of the development of patterns of fear.
A market that is stirred shows high volatility within the context of an existing trend. A market that is shaken moves out of its existing trend and starts the development of a new trend. The 3 percent fall in the Dow occurred within the context of the existing trend. It did not initiate a new trend behavior.
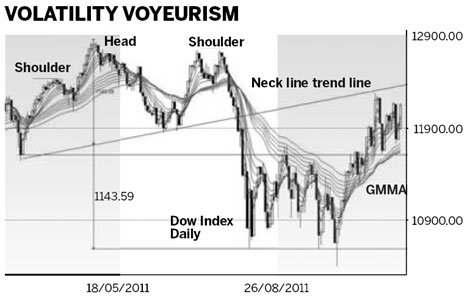
The existing trend in the Dow is a continuation of the breakout from the longer term pattern of fear - the head-and-shoulders upward trend reversal pattern. A neckline is drawn between the two low points of this pattern. The distance between the peak of the head and the neckline is measured and projected downward to give a downside target. The fall following the head-and-shoulders pattern on the Dow achieved its exact target projections. This shows the validity of the pattern and this is important because the same pattern is used to help set the limits of the current trend breakout.
This fall was followed by a period of L-shaped consolidation activity. The weekly close above 11600 was clear evidence the L-shaped consolidation breakout was confirmed. The upside target for a move above this 11600 was near 12600 which was calculated by taking the width of the L-shape consolidation band and projecting it upward. The 11600 level now becomes an important support level for the new upward-trend breakout activity.
The initial upside target for the breakout was lower and located near 12300. This was calculated by using the value of the head-and-shoulders neckline projected to the right of the chart pattern. The lingering influence of the head-and-shoulders pattern neckline proved more powerful and the market retreated away from 12300.
The retreat from 12300 was rapid and it has tested support near 11600. In the longer term this is a sustainable breakout with a target near 12600. Getting to that target level will be more difficult because of the resistance from the neckline projection. Using the slope of the neckline suggests the 12600 target is achievable in January 2012.
The relationship with the Guppy Multiple Moving Averages (GMMA) indicator suggests this is a genuine and sustainable trend change. The GMMA indicator tracks the thinking and activity of investors and compares this with the thinking and activity of traders. Without getting too technical, there are several factors in this analysis.
The first is the pattern of test and retest of the long-term GMMA. The index breakout above the upper edge of the long-term GMMA is followed by successful test and rebound from the upper edge. This is quite typical of sustainable trend breakout behavior.
The second is the rapid compression in the long-term GMMA and the way it turns upward. The compression behavior shows investors have reached agreement on price and value. The key test in coming weeks is the ability of the long term GMMA to continue to absorb selling pressure. A widening of this group confirms investors have entered the market as buyers.
Other technical charting indicators such as the Relative Strength Index also confirmed the strong potential for a sustainable trend change. This shows a divergence pattern and this is a leading indicator of a trend reversal.
It is too early to plot a valid trend line to define the new rising trend. Another set of retreat and rebound points is required for good trend-line placement and this may develop in the next five to 10 days.
The L-shaped consolidation pattern targets remain the long-term target level near 12600. The danger is that these may represent temporary highs rather than a trend continuation pattern so investors will be alert for developing consolidation and weakness near the 12600 level. This may include a bearish RSI divergence pattern.
The alternative development is a continuation of the strong volatility behavior between 11600 support and the resistance line created by the projected neckline. It is not a comfortable time for investors, but while the market remains in this area we can say it is stirred, but not shaken. A fall below 11600 signals a change in the trend breakout behavior and that will shake the Dow.
The author is a well-known international financial technical analysis expert.
(China Daily 11/14/2011 page14)