Investment
Charts revealing uncertain market
By Daryl Guppy (China Daily)
Updated: 2010-08-09 14:39
 |
Large Medium Small |

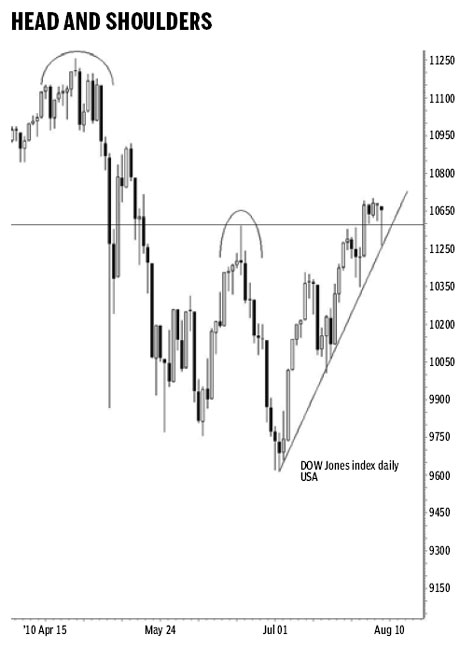
The head and shoulder pattern that has developed in the Dow Jones index has been technically invalidated by the weekly close above 10600. It is a powerful reversal pattern that has around 80 percent reliability. When it develops, then eight times out of 10 it will continue to develop and achieve its downside targets.
If the definition of the head and shoulder pattern is less rigorous then the results become less reliable. It is created by a series of three rallies and retreats developing over several months. This is not a short term pattern of behavior. It captures the broad macro-economic changes in economic activity. The first rally and retreat creates the left shoulder. The higher rally creates the head and the third rally and retreat creates the right shoulder. The retreat lows in the shoulders are joined by a trend line to create a neckline. The distance between the neckline and the head is measured and used to calculate downside targets.
Many investors are breathing a sigh of relief that the technical head and shoulder pattern has been invalidated. Other investors are still cautious. They worry about the weak fundamental information coming from the United States. This included a series of shocks from unemployment figures and retail spending. The collapse of the dollar index to below $0.81 is attributed by some to suggestions that the Federal Reserve will continue with quantitative easing. This is the official language for continuing to print more money. These concerns are also reflected in the gold price rebound from support at $1,160.
Caution is also signaled by the weakness in the breakout above 10600. The initial move above 10600 was strong, but then a pullback developed with some weak consolidation behavior. This is a pattern of exhaustion. So much effort has been required to break above 10600 that the market appears to have lost the energy necessary for a continuation of the momentum.
Caution comes also from the historical pattern of behavior with the Dow in 1930. The head and shoulder reversal pattern then included an unusual double shoulder on the right side of the pattern. The first rally to 274 created the right shoulder in 1930. The market retreated and then rallied again and made a higher high at 277. This was about 1 percent higher. The market then collapsed from the second right shoulder in the pattern. The double shoulder is a rarity, which is what makes the current Dow index activity particularly interesting.
The first right shoulder on the current Dow reached 10600. The current rally is struggling to move above 10700. This is about 1 percent higher than the peak on the first rally in the right shoulder. Failure to move above 10700 and failure to stay above 10600 suggests that the unusual double shoulder pattern may be developing again.
These behaviors signal caution. They remain an historical curiosity until the Dow moves below the new uptrend line starting from the July 2 low and using the rebound lows in July 21 as the second anchor point for the uptrend line. A close below this trend line indicates a clear change in trend and would also confirm the development of the double right shoulder pattern.
The case for the bulls is confirmed most strongly with a continued rebound above 10600 and a successful test of this level as a new support level. The case for the bulls remains intact with a market retreat that continues to use the new uptrend line as a support level. There is no pattern of chart behaviors that provides a method for setting upside targets for the bullish breakout. Minor resistance is near 10900. Traders look for resistance to develop near 11170 as the old highs are retested.
Investors remain cautious and watch for confirmation of the historical parallels in market behavior. Traders have enjoyed the rally from 10100 to above 10600 but many are using protective stops based on the uptrend line or the support level at 10600. This remains an uncertain market and a bearish retreat has the potential to trigger a wave of selling.
The author is a well-known international financial technical analysis expert