The bears put pressure on the bigger markets
Updated: 2011-09-26 07:51
By Daryl Guppy (China Daily)
|
|||||||||

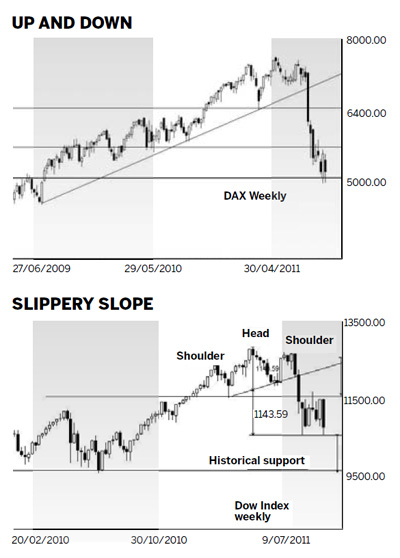
Global markets turned savagely down last week. It was a surprise to many, but not a surprise to investors who use charts. The dramatic falls on the Dow index simply retested the lows calculated from the head-and-shoulders reversal pattern. Markets are showing a very high degree of volatility as they pound out consolidation patterns. These large rises and falls are unnerving but they are part of consolidation behavior.
The real problem is what happens after the consolidation pattern is completed. They all seem to be developing an L-shaped consolidation behavior. This is a sideways movement defined by a support level and a resistance level. The width of the band is measured and this value is used to calculate the potential upside targets and the potential downside targets.
The upside targets do not suggest a strong market recovery in the United States, the United Kingdom or Germany. Even if the market breaks above the L-shaped consolidation resistance levels they still have several other resistance barriers.
There is a higher probability of a breakout on the downside so this week we look at the potential downside targets and how they are calculated for each of the three major international markets.
The Dow index is dominated by the head-and-shoulders pattern. The width of the pattern is measured and this value is projected downward. This is called a measured-move calculation. The downside target for this pattern is at 10600. This has been achieved once, and this level is being tested again. The width of the consolidation pattern is around 1000 index points.
When this value is projected downward it gives the next downside target near 9600. This is the same level as a strong historical support level so there is a higher probability a new consolidation pattern will develop at this level. A fall below this level gives a downside target near 8600. This is the same level as the inverted head-and-shoulders neckline that confirmed the upside breakout in 2009.
In a severe market fall such as 2008, it is common for the initial head-and-shoulders pattern to achieve a fall equal to three times the depth of the original head-and-shoulders pattern.
The English FTSE index has a different pattern. This is a rounding top pattern. The base of the pattern is near 5600. The top of the pattern is near 6100. This is the peak of the rounding top-trend line, not the peak of the index. The depth of this pattern is measured and projected downward. This gives a downside target near 5100. This is little above the strong historical support at 5000 so there is a high probability the market will fall to the 5000 support level. This developed and the market has created an L-shaped consolidation at this level.
A fall below support at 5000 has a new downside target near 4550. This target takes the width of the rounding top pattern, but it starts the projection from the 5000 support level. The 4550 level is also a long-term historical support level. In 2009 this was a resistance level. The move above this level in 2009 confirmed the market recovery.
Rounding top patterns often develop to double the original pattern measurement.
The German DAX index is very different. There is not any trend-reversal pattern on the chart. The DAX signaled a market collapse when it moved below the long-term upward trend line. This was a sudden market collapse and there was not any method to calculate a measured downward move. Instead it is the historical support levels that provide the downside targets for the DAX. The first strong support level is near 5700.
The next support level is near 5100. The market is currently creating an L-shaped consolidation between these two levels.
The fall in the DAX is more severe than that of the Dow and the FTSE because at 5100 the DAX has already reached the resistance level that defined the upside breakout for the inverted head-and-shoulders pattern that started the new upward trend market recovery in 2009.
The width of this consolidation is 600 index points and this is used to calculate the downside target near 4400. This is not a strong historical support level so the market may fall further toward 4000. For the DAX there is already a very high probability of a double-dip recession. All three global markets show heavy bearish pressure.
The author is a well-known international financial technical analysis expert.
(China Daily 09/26/2011 page14)