Calculating trends in the price of oil
Updated: 2011-11-21 07:56
By Daryl Guppy (China Daily)
|
|||||||||
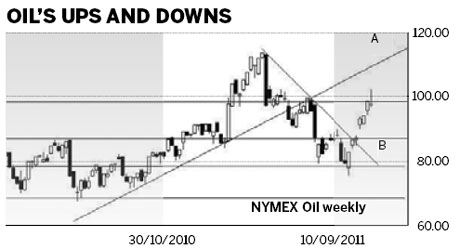
The NYMEX oil chart shows a combination of dynamic and static features. The static factors are provided by the historic horizontal support and resistance levels. These are static because the market makes constant reference to these levels and the positions of the levels do not change over time. They remain constant for several years. Every rise and fall in the oil price pauses near these historical levels.
The dynamic factors are determined by trend lines. The trend line is dynamic in two ways. First, trend lines are dynamic because their starting and ending positions depend upon recent and current price activity. The influence of the trend line may continue for an extended period, but it is not locked in place like support and resistance levels.
The second aspect of the dynamic nature of the trend line is the way it changes in value. The value of the trend line changes because it slopes over time. In an upward sloping trend today's value is lower than the projected value of the trend line in 10 days. This is important when considering the way the trend line acts as a support or resistance level. The value of this support or resistance changes and this makes it a dynamic feature on the chart.

The static forces are support/resistance levels at $78, $87 and $98. The upper level near $98 has an added complication because it is just below the psychological resistance level at $100. When the oil price is below $100 the volatility and activity is relatively subdued. Price often moves rapidly between the support and resistance levels, but develops consolidation behavior at each level.
When the oil price moves above $100 the volatility increases and there is a greater potential for bubble behavior to develop. Once the price is above $100 the price behavior changes. The first change in behavior is an increase in volatility. The price moves up and down more rapidly and more frequently between support and resistance levels than when oil is below $100. The second change in behavior is an increase in the width of the support and resistance bands to around $12.
The current breakout above $100 is very strong. The price did not consolidate between $98 and $100 and this suggests powerful trend behavior. The breakout above $100 brings the dynamic resistance factors into play.
There are two dynamic features - trend line A and trend line B. The breakout from downward trend line B signaled the start of the new upward trend. This breakout had the features of a rally with several weeks of strong upward pressure on the weekly chart. Traders looked for a retreat from near $100 followed by a rebound point that will provide the first anchor point for a new upward trend line. This did not develop and the price moved rapidly above $100.
Without a retreat and rebound point it is difficult to plot an accurate upward trend line. This confirms the current activity is a powerful rally. Prolonged rallies are often followed by a rapid retreat because the fast moving rally is unsustainable. The height of this rally is limited by the second dynamic feature on the oil chart.
The second dynamic feature is provided by trend line A. This line acted as a support level from September 2010 until June 2011. The move below the trend line A saw the line act as a resistance level. Trend line A is projected forward into the future and this becomes a new resistance level. This provides a limit on the price rally above the $100 resistance level. The value of this line is used to help determine the potential high points, and retreat point, for any breakout rally.
The first rally price target is near $111 with the potential to move to $112. This is calculated using the value of trend line A. This breakout projection target is consistent with the way oil price volatility develops after a move above $100.
The most bullish outcome is when the price clusters just under the value of trend line A. This would suggest a strong continuation of the rally trend in oil with a longer-term breakout target near $124.
A strong retreat from trend line A has support near $100. Consolidation near $100 would provide the second anchor point for a new upward trend line and this would be used to define a sustainable long-term upward trend. This trend includes a slower and more sustainable upward move toward $115 and higher.
The author is a well-known international financial technical analysis expert.
(China Daily 11/21/2011 page14)